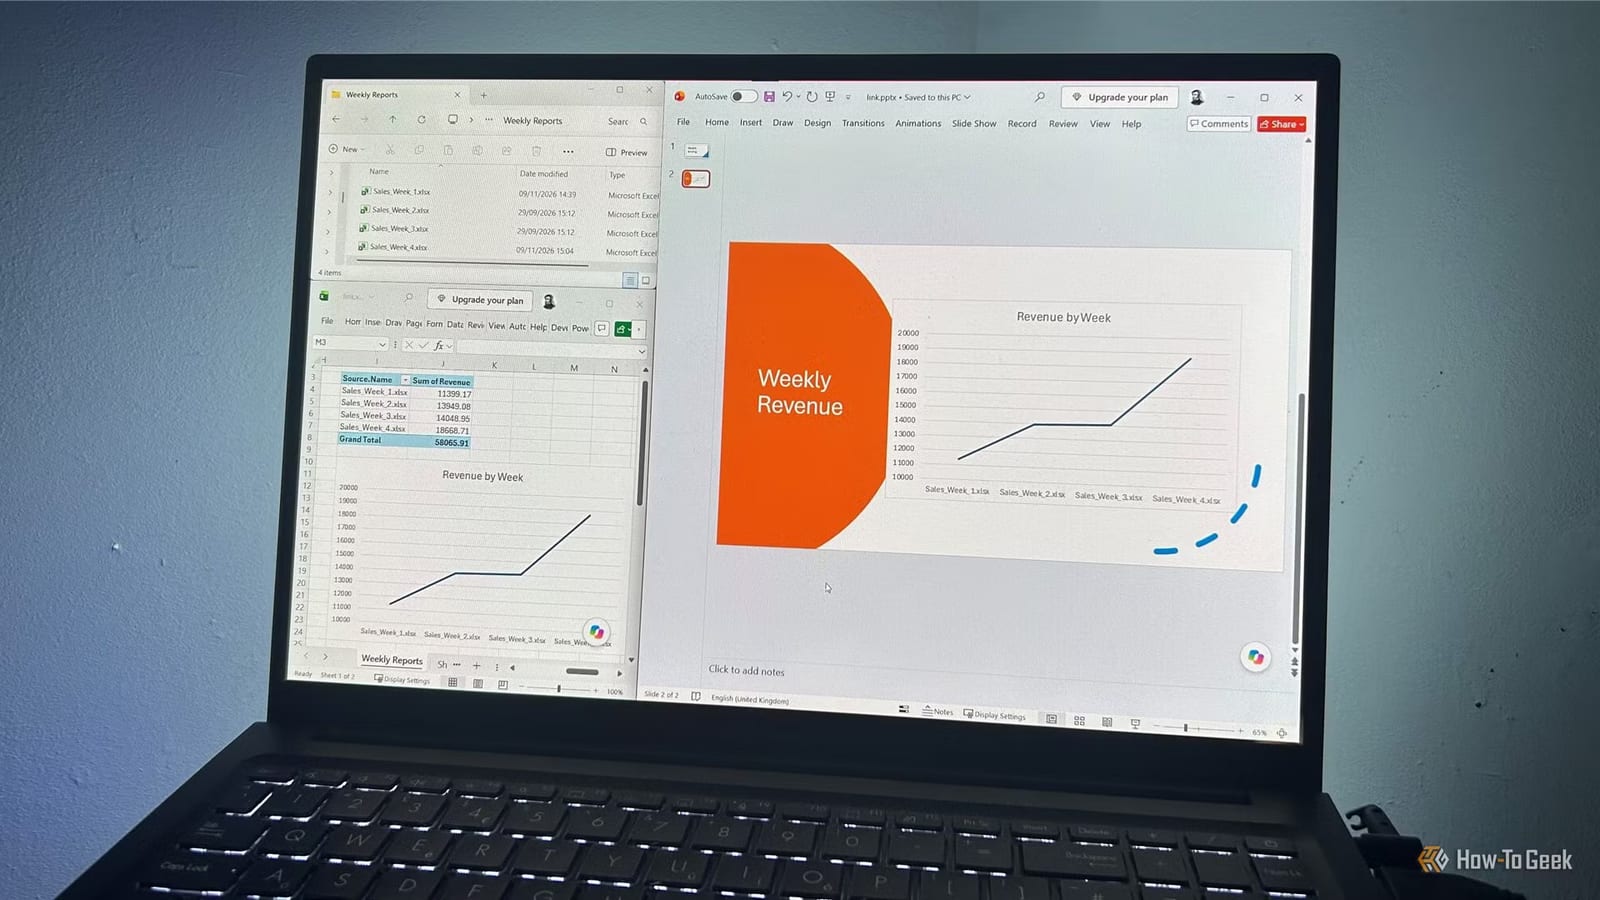
A weekly report no longer has to mean rebuilding the same chart by hand. Tony Phillips, a senior author at How-To Geek, describes a setup where new Excel reports go into one folder, a refresh combines them, and the linked PowerPoint slide updates to match.
What the setup does
It joins two Microsoft 365 features. The first is Power Query, an Excel tool that can pull data from every file in a folder and merge it into one list. The second is PowerPoint's ability to show a chart that stays connected to an Excel file. Excel handles the numbers. PowerPoint handles the presentation.
How it fits together
- Weekly Excel reports sit in one folder. Power Query is pointed at the folder through Data > Get Data > From File > From Folder.
- A PivotTable, which is a summary table, totals revenue for each weekly report.
- A PivotChart, a chart built on that summary, shows how revenue changes from one report to the next.
- The chart is pasted into PowerPoint with Paste Special > Paste Link > Microsoft Excel Chart Object.
The summary step matters. Each weekly file holds many sales records, so charting the raw data would look cluttered. Grouping by source workbook gives one simple view per week.
Why a link beats a copy
A normal paste puts a frozen snapshot of the chart on the slide. When the data changes, the slide drifts out of date. A pasted link keeps the slide tied to the Excel file, so the chart can be refreshed instead of replaced.
The weekly routine
In the example, a presentation holds a chart based on three weekly reports. When the Week 4 report arrives, it goes into the same folder. Then the reporting workbook is opened and Refresh All is clicked. That updates the Power Query results, the PivotTable and the PivotChart together. After saving the workbook, the PowerPoint file is opened and Update is clicked when prompted.
Where it can go wrong
Consistency is the most important part. Every weekly report needs the same worksheet name, column headings and layout. If they differ, combining the files can fail.
File location can also cause trouble. In the author's testing, linked charts worked more reliably when the source workbook was in a local folder rather than a cloud-synced OneDrive location. If PowerPoint cannot find the workbook, the link will not update. When that happens, check the link source and where the file is stored.
Who it helps
Anyone who shows the same numbers every week, such as sales or revenue, could save repeat work. It also lowers the risk of presenting an outdated chart, since the slide pulls from the same file that holds the latest data.
The takeawayIf the same weekly report feeds a slide, keep the files identical in layout and link the chart instead of pasting a copy.